Cloud Monitoring & Observability – Grafana, Prometheus, Loki & Tempo
A unified observability stack built on Prometheus, Loki, Tempo, and Grafana gives teams running containerized workloads on Amazon EKS and Amazon ECS a single place to see metrics, logs, and traces together. Long-term data is stored cost-effectively in Amazon S3, and alerts flow from Prometheus Alertmanager through Amazon SNS to the on-call team in Slack and PagerDuty, so issues are detected, routed, and diagnosed in minutes.
Benefits
uptime, backed by multi-AZ task placement and ECS automated recovery
faster deployment speed with automated blue/green pipelines
improvement in engineering team efficiency on AWS Fargate
Metrics, logs, and traces explored side by side in Grafana dashboards
Jump from a metric spike to the related logs and the exact request trace in a few clicks
Loki and Tempo store data in Amazon S3, keeping long retention affordable
Prometheus alerts grouped, de-duplicated, and delivered through Amazon SNS to Slack and PagerDuty
Built on open-source tools and OpenTelemetry, with no proprietary agents or lock-in
One stack covering workloads on both Amazon EKS and Amazon ECS
Overview
As applications move to containers and microservices, a single user request can pass through many services running across dozens of short-lived pods or tasks. Traditional monitoring, with separate tools for logs, metrics, and application performance, makes it hard to follow what happened. Engineers switch between consoles, match timestamps by hand, and often learn about problems from users before any alert fires.
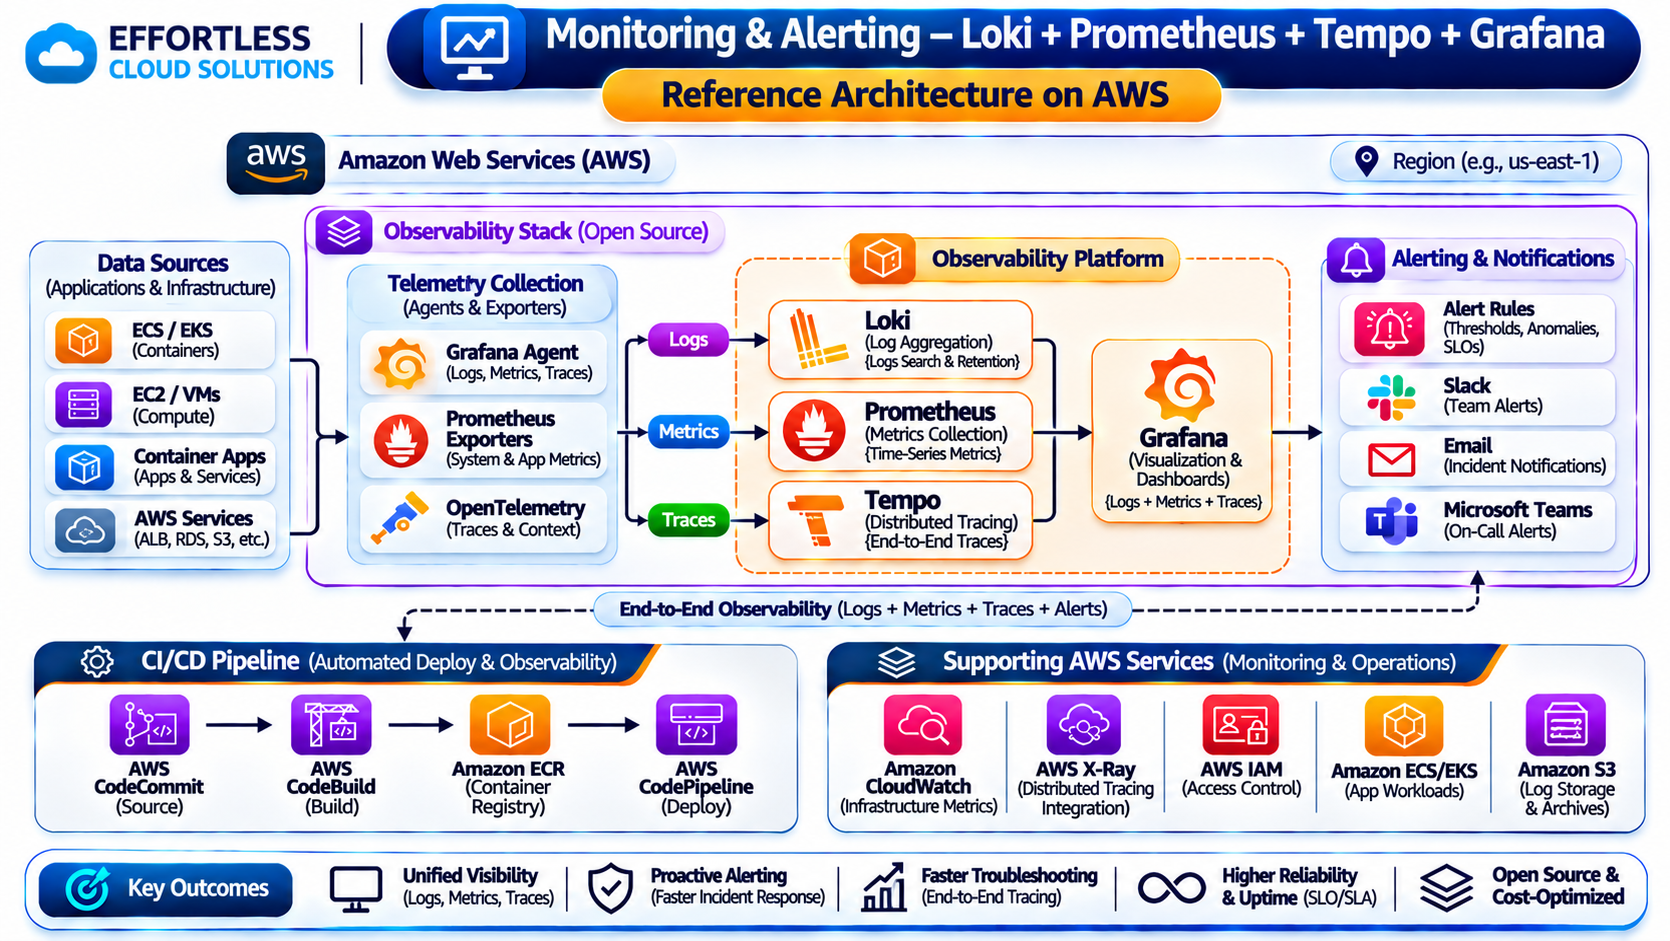
A full observability stack solves this. Application services running on Amazon EKS and Amazon ECS send logs to Loki, expose metrics that Prometheus scrapes, and emit distributed traces to Tempo. Loki and Tempo store their data in Amazon S3, and Grafana queries all three sources to give one connected view. Prometheus evaluates alerting rules and sends alerts to Alertmanager, which routes them through Amazon SNS to Slack and PagerDuty so the on-call team is notified right away.
About the Observability Stack
Prometheus is an open-source monitoring system that collects time-series metrics by scraping application and infrastructure endpoints, and evaluates alerting rules against them. Alertmanager receives those alerts, groups and de-duplicates them, applies silences and inhibition rules, and routes them to receivers such as Amazon SNS. Grafana Loki is a log aggregation system that indexes only labels rather than full log text, which makes it efficient to run and cheap to store. Grafana Tempo is a distributed tracing backend that stores traces in object storage and supports OpenTelemetry, Jaeger, and Zipkin formats. Grafana brings them together with dashboards, ad hoc exploration, and links between metrics, logs, and traces. On AWS, Amazon S3 provides durable, low-cost storage for Loki and Tempo, and Amazon SNS provides reliable fan-out of alert notifications.
Opportunity: Moving Beyond Fragmented Monitoring
When monitoring is spread across separate tools, each answers only part of the question. Metrics show that latency has increased but not why. Logs are scattered across containers that may already have been replaced, and searching them requires knowing exactly where to look. Without distributed tracing, there is no way to see which downstream service caused a slow request.
Alerting is often noisy or incomplete. Threshold alerts fire repeatedly for the same incident, notifications go to shared email inboxes that nobody watches at night, and there is no clear escalation to the person on call. At the same time, commercial observability platforms that charge by data volume become expensive as log and trace volumes grow, forcing teams to reduce retention or sample away useful data.
Organizations in this position need an observability platform that correlates metrics, logs, and traces, routes actionable alerts to the right people, and keeps costs predictable as the environment scales.
The Solution
Telemetry Collection
Application services on Amazon EKS and Amazon ECS produce three types of telemetry. Logs are shipped to Loki by a collection agent such as Grafana Alloy or Fluent Bit, running as a DaemonSet on EKS and through FireLens on ECS. Metrics are exposed on a /metrics endpoint for Prometheus to scrape, with Kubernetes service discovery finding EKS pods automatically. Traces are generated with OpenTelemetry instrumentation and sent to Tempo.
Metrics with Prometheus
Prometheus scrapes application, container, and node metrics at regular intervals, including request rates, error rates, latency percentiles, and resource usage. Recording rules pre-compute frequently used queries so dashboards stay fast, and alerting rules define the conditions that signal a real problem, such as a rising error rate or a service missing its latency objective.
Log Aggregation with Loki
Loki receives logs from every pod and task and labels them by cluster, namespace, service, and environment. Because Loki indexes only these labels, ingestion is lightweight, and engineers search logs with LogQL to filter, parse, and count events across all services at once.
Distributed Tracing with Tempo
Tempo stores traces that follow each request across service boundaries, showing the time spent in every service and dependency. Trace IDs are added to log lines, so Grafana can link a log entry directly to its full trace, and Prometheus exemplars link latency spikes on a graph to example traces.
Durable, Low-Cost Storage on Amazon S3
Loki stores log chunks and indexes, and Tempo stores trace blocks, in Amazon S3. S3 provides highly durable storage at a fraction of the cost of block storage, and lifecycle policies remove or tier older data automatically according to retention requirements. Buckets are encrypted with SSE-S3 or AWS KMS and block all public access, and the stack accesses them through IAM roles rather than stored access keys.
Unified Dashboards in Grafana
Grafana connects to Prometheus, Loki, and Tempo as data sources. Service dashboards show the key signals for each application, such as request rate, errors, and duration, and engineers can move from a dashboard panel to the matching logs and traces for the same time window without changing tools.
Alerting with Alertmanager and Amazon SNS
When an alerting rule fires, Prometheus sends the alert to Alertmanager. Alertmanager groups related alerts into a single notification, removes duplicates, suppresses lower-priority alerts while a related critical alert is active, and honors silences during planned maintenance. Alerts are then published to Amazon SNS topics by severity.
On-Call Notification
Amazon SNS delivers alerts to Slack channels for team visibility and to PagerDuty for critical incidents that need an immediate response. PagerDuty applies on-call schedules and escalation policies, so the right engineer is paged and the incident is escalated if it is not acknowledged.
Secure, Scalable Deployment
The stack runs on Amazon EKS and is deployed with Helm charts and managed as code. Components run with multiple replicas for resilience, IAM roles grant only the S3 and SNS permissions each component needs, and Grafana access is controlled through single sign-on and role-based permissions.
Results
Faster Incident Detection
Alerting rules on error rates and latency notify the on-call team through PagerDuty within minutes of a problem starting, usually before users report it.
Shorter Time to Resolution
Engineers move from an alert to the related dashboard, logs, and request trace in one tool, cutting the time spent searching for the cause.
Less Alert Noise
Grouping, de-duplication, inhibition, and silences in Alertmanager turn bursts of related alerts into a single, actionable notification.
Predictable Observability Costs
Label-based log indexing in Loki and object storage in Amazon S3 keep costs low as data volumes grow, allowing longer retention without sampling away important data.
Visibility Across Every Service
Every service on Amazon EKS and Amazon ECS reports metrics, logs, and traces in a consistent way, so no part of the platform is a blind spot.
No Vendor Lock-In
Open-source components and OpenTelemetry instrumentation keep telemetry portable, so the stack can evolve without re-instrumenting applications.
Proactive Operations
Dashboards and trend data let teams spot capacity limits and performance regressions early and fix them before they become incidents.
AWS Services Used
Core AWS building blocks powering high availability, elastic scaling, security, and automated deployments.
Amazon EKS
Managed Kubernetes cluster hosting production container workloads and running the unified Prometheus, Loki, Tempo, and Grafana stack.
Amazon ECS
Fully managed container orchestration running services configured with FireLens and OpenTelemetry exporters shipping telemetry.
Amazon S3
Durable, encrypted cloud object storage backing high-volume log chunks and distributed trace storage with lifecycle tiering policies.
Amazon SNS
High-throughput publish-subscribe messaging service routing real-time operational notifications and critical alerts to on-call channels.
AWS IAM
Fine-grained service account roles granting secure, credential-free read/write permissions directly to S3 buckets and SNS topics.
AWS KMS
Customer-managed cryptographic keys securing all observability log archives and distributed trace blocks at rest in S3.
Prometheus (Open Source)
Industry-standard time-series metrics engine scraping application, container, and node endpoints with proactive alert rule evaluation.
Alertmanager (Open Source)
Handles operational alerts generated by Prometheus, grouping related notifications and dispatching deduplicated alerts to Amazon SNS.
Grafana Loki (Open Source)
Horizontally scalable, multi-tenant log aggregation system indexing metadata labels to make full-stack log search cost-effective.
Grafana Tempo (Open Source)
High-scale distributed tracing backend supporting OpenTelemetry traces stored directly in object storage for instant root-cause analysis.
Grafana (Open Source)
Unified operational visualization platform linking real-time metrics, logs, and end-to-end request traces in single-pane dashboards.
Send Us a Message
Ready to bring your ideas to life? Tell us about your project and our team will get back to you within one business day.
Denver, CO 80231